CLIMADA features
Main characteristics
-
CLIMADA is a framework, not a data model. It focuses on broad applications and flexibility rather than data
fine-tuning.
-
Code Architecture: The code is divided into
core modules
(very high stability) and
petals modules
(advanced optional features and data models).
- Supports multiple geographical scales: Worldwide, Country, Region, City, ...
- Handles various event types: probabilistic sets, single events, time series, ...
-
Adapts to different time scales: annual extremes, isolated events, seasonal or monthly
extremes, hourly forecasts, ...
-
Supports multiple hazards: Tropical cyclones, Winter storms, Wildfires, Floods, Drought,
Heatwaves, ...
-
Applicable to diverse exposures: People, Ecosystems, Assets, Economic supply chains, Critical
infrastructures, Heritage sites, Coral reefs, Wind turbines, ...
-
Risk and impact: past, present, and future, including adaptation options.
-
Offers various output metrics: impact at location, return period curves, risk
transfer metrics, average impact, risk maps, forecast probabilities, warning
levels, ...
-
Applications
: risk assessment, adaptation option appraisal, storylines, forecasting,
insurance pricing, impact attribution, ...
Major modules
Optimal sovereign NatCatBond pools
The
CatBond
module enables to create and evaluate parametric souvereign CAT bonds and design optimal multi-country pools.
Bergmüller et al (2026)
[DOI: 10.2139/ssrn.6030454].
Risk Trajectories
The
Trajectories
module allows to define risk at different points in time and interpolate in between.
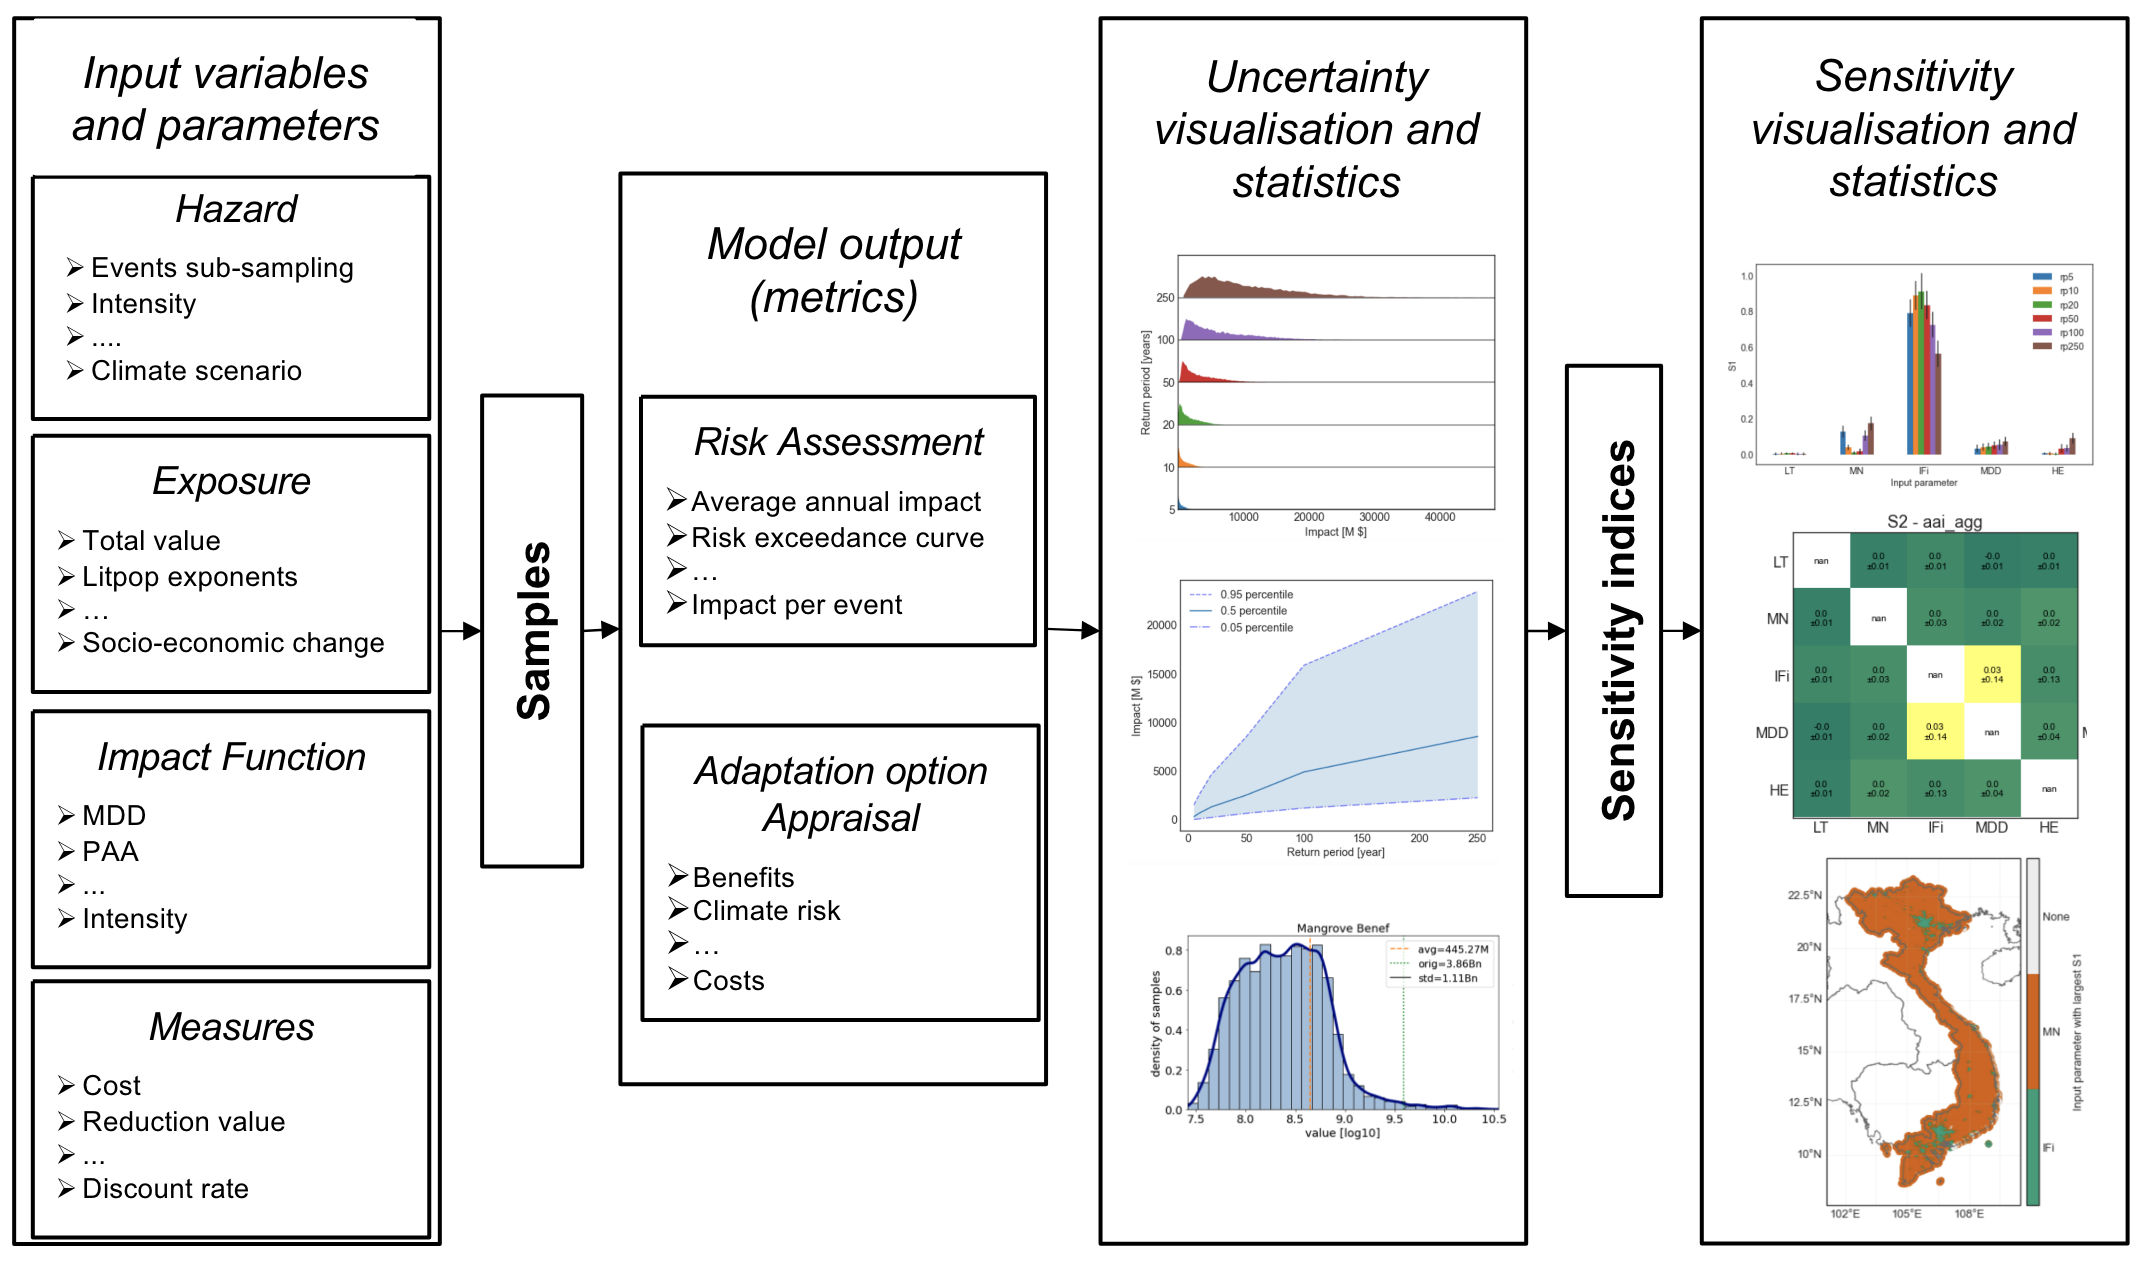
UNSEQUA (Uncertainty and Sensitivity Quantification)
The
UNSEQUA module allows running global uncertainty and sensitivity analysis on CLIMADA's impact and
adaptation option appraisal outputs. It utilizes state-of-the-art algorithms for quasi-Monte Carlo sampling and
sensitivity index calculation using the
SALib
package.
Kropf et al. (2022)
[DOI: 10.5194/gmd-2021-437].
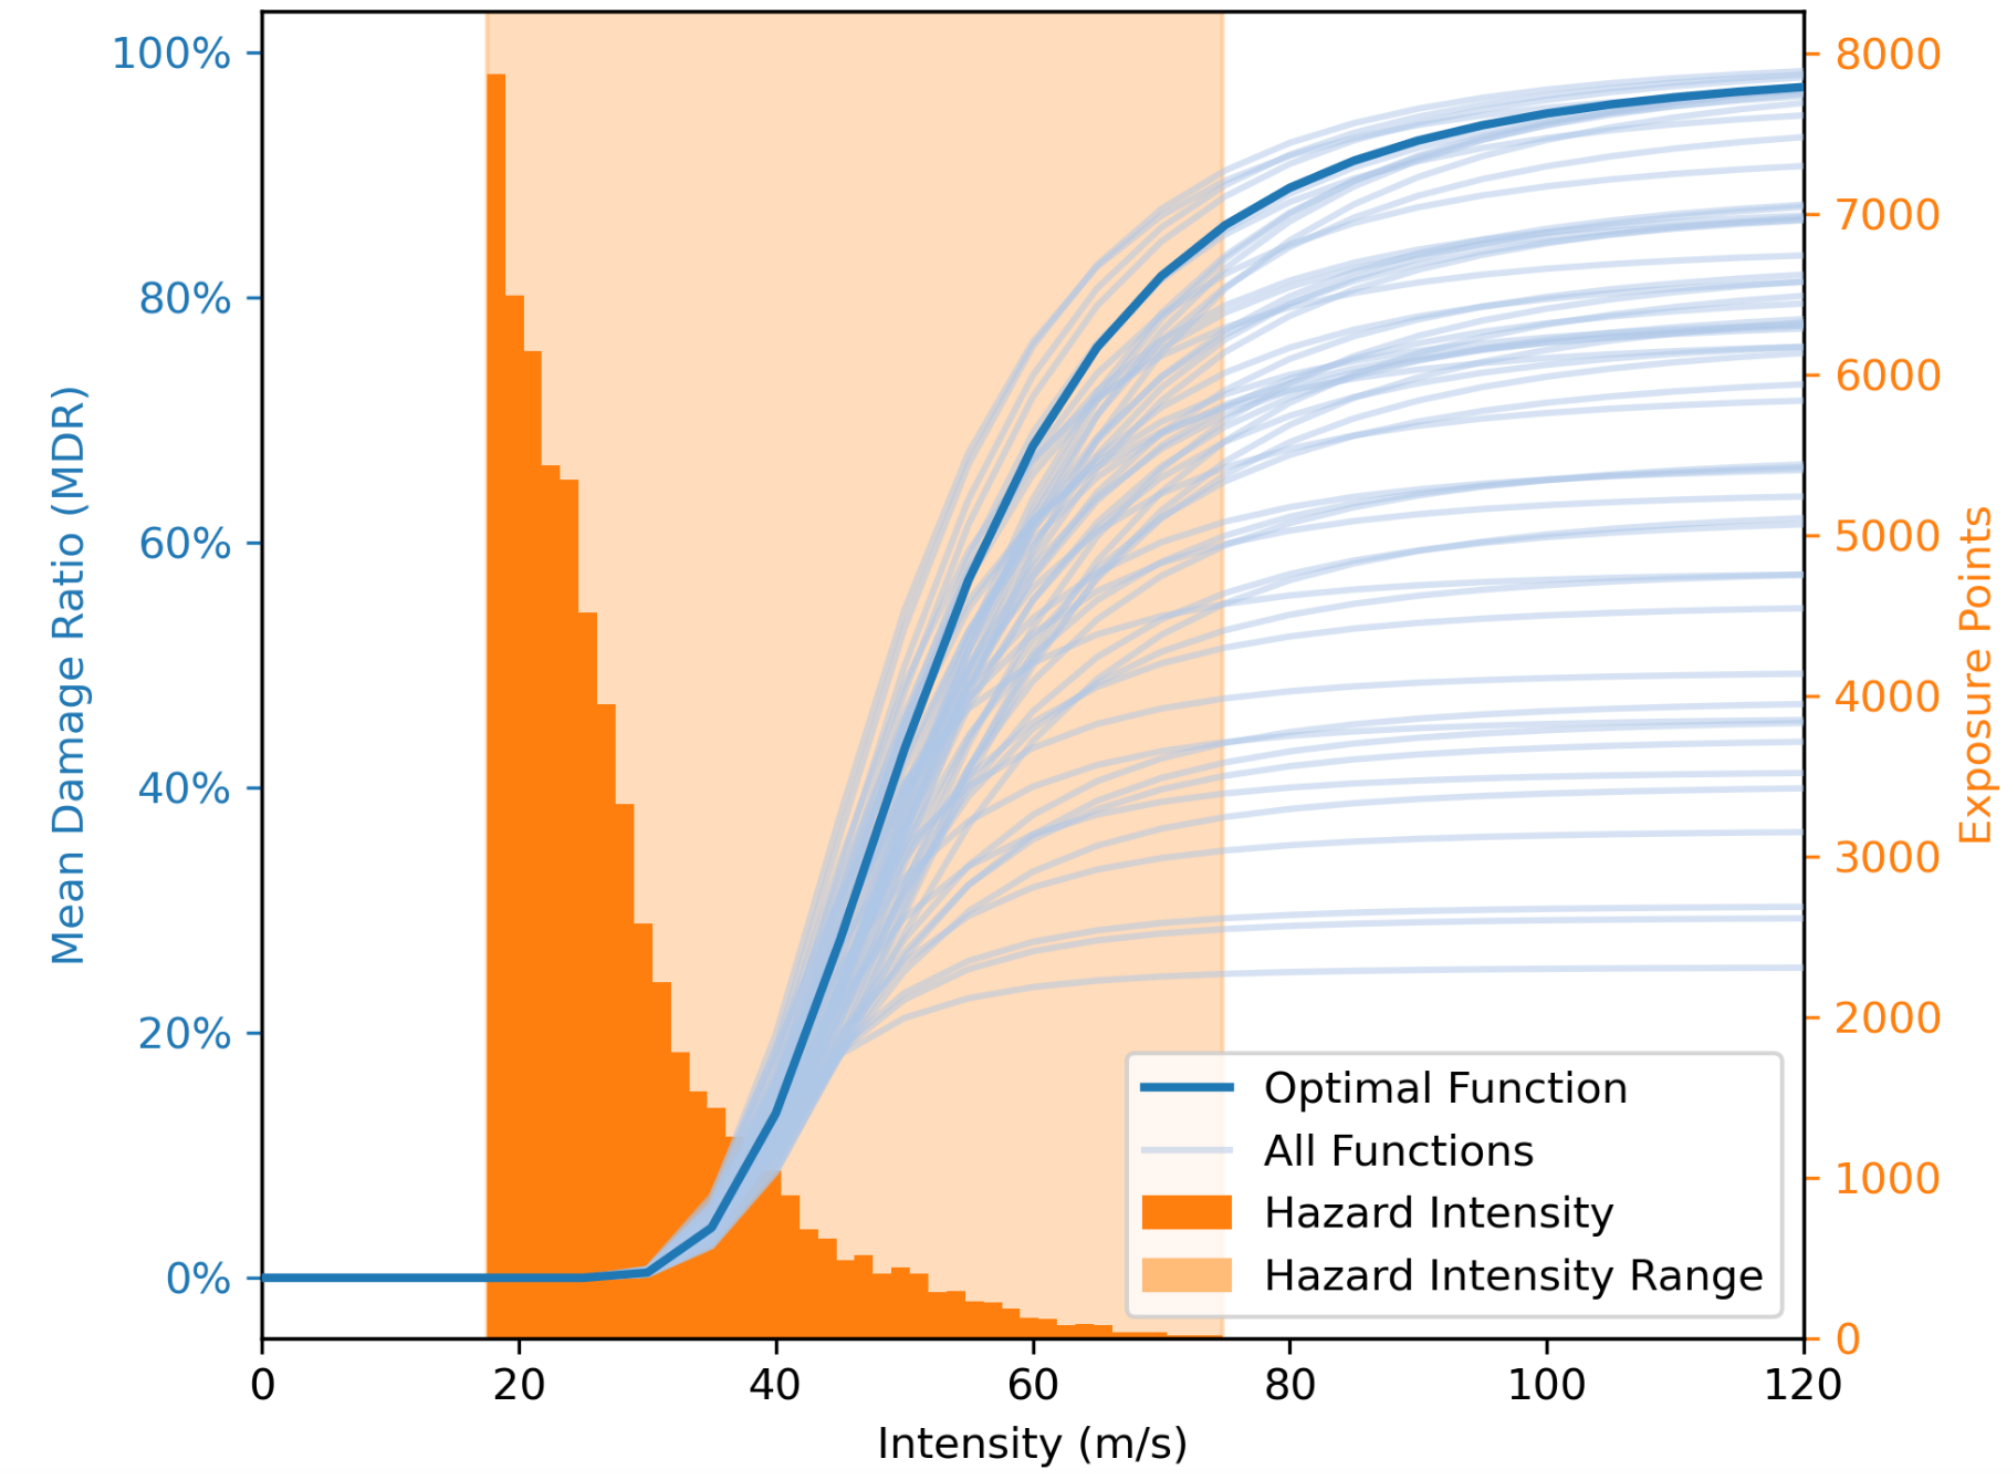
Impact Function Calibration
Calibrate impact functions
for each impact assessment to ensure the model is truly aligned with your data.
Seamlessly connect the obtained ensembles of impact estimates or average ensembles
to the UNSEQUA module for uncertainty quantification.
Riedel et al. (2024)
[DOI: 10.21105/joss.06755].
Lines and Polygon Handler
The
lines and polygons handler
enables seamless disaggregation and aggregation of exposure and impact data into lines and polygons.
Mühlhofer et al. (2024)
[DOI: 10.1088/2515-7620/ad15ab].
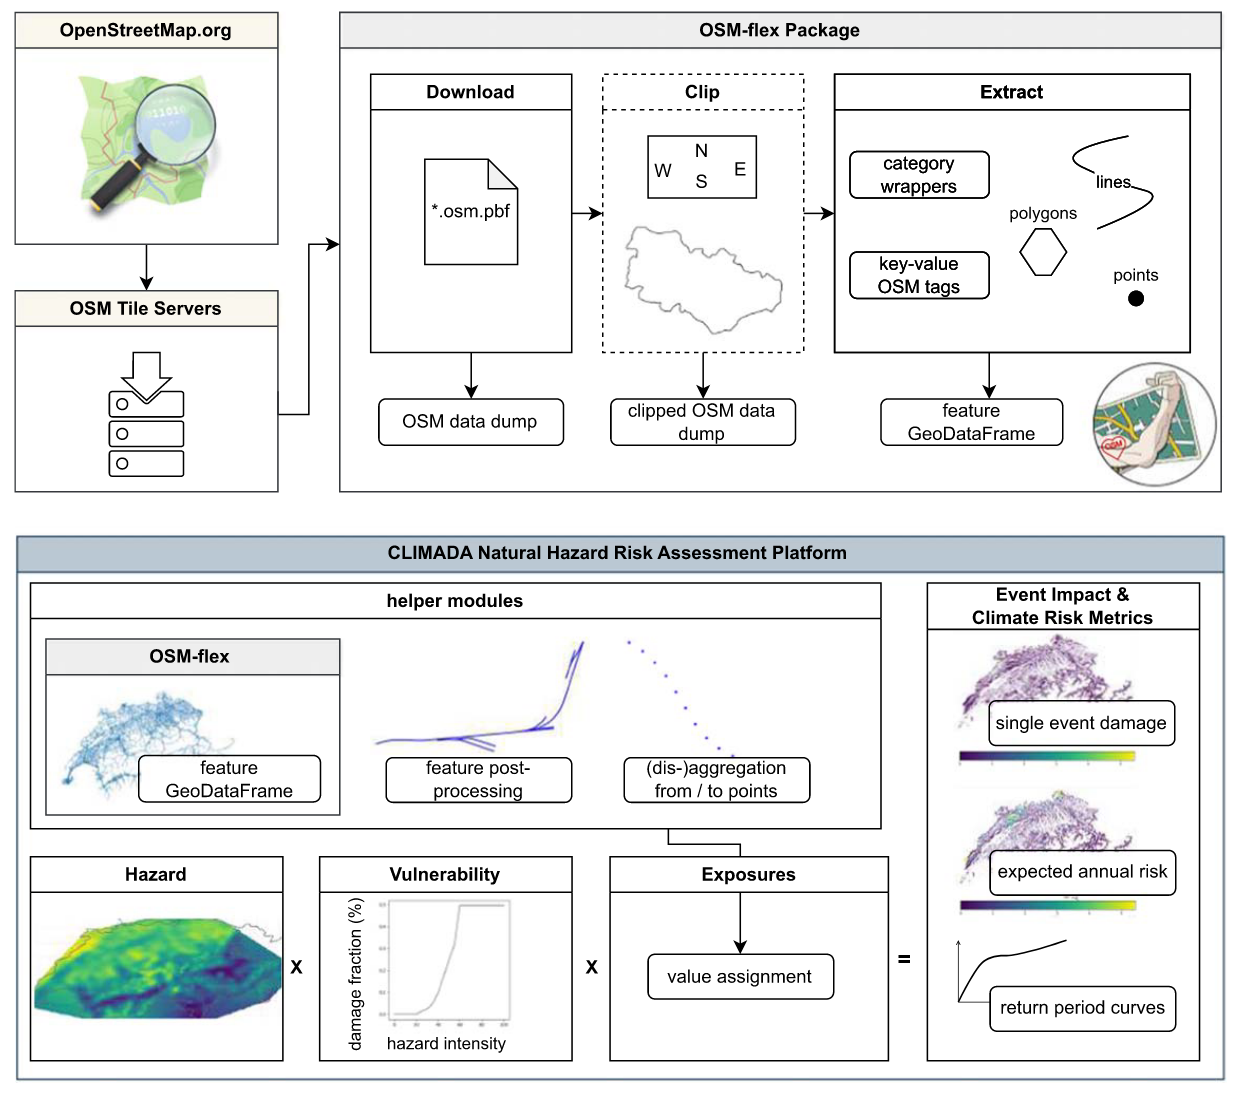
OpenStreetMap Integration
Seamlessly integrate any element from OpenStreetMap as an exposure layer into CLIMADA using the
OSMflex package.
Mühlhofer et al. (2024)
[DOI: 10.1088/2515-7620/ad15ab].
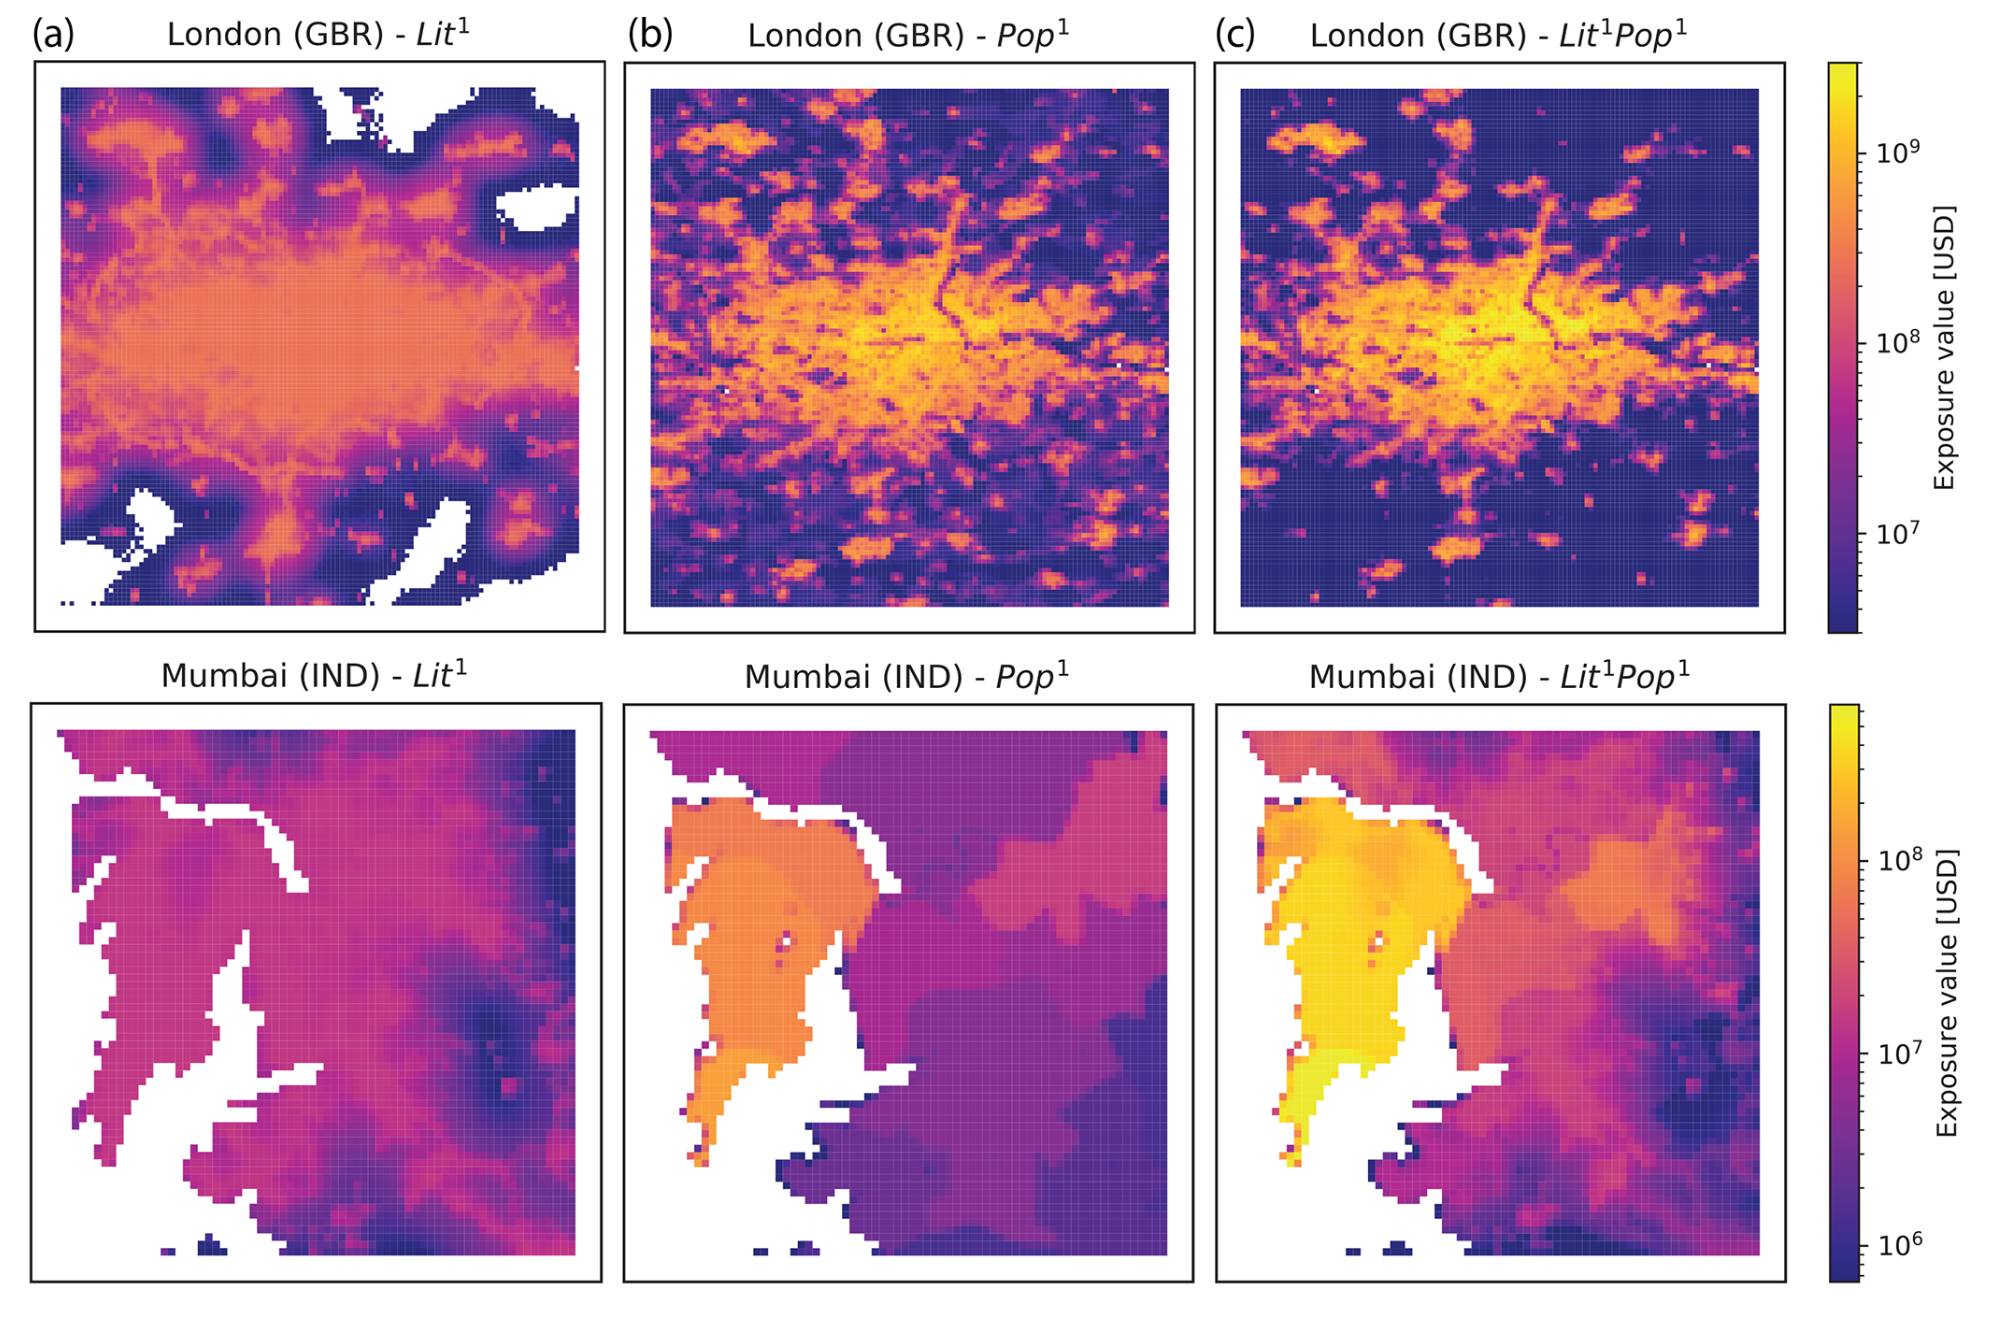
LitPop - Asset Exposure Estimation
The
LitPop
module generates globally consistent physical asset exposure layer estimates based on population data,
nightlight satellite imagery, and GDP estimates.
Eberenz et al. (2020)
[DOI: 10.5194/essd-12-817-2020].
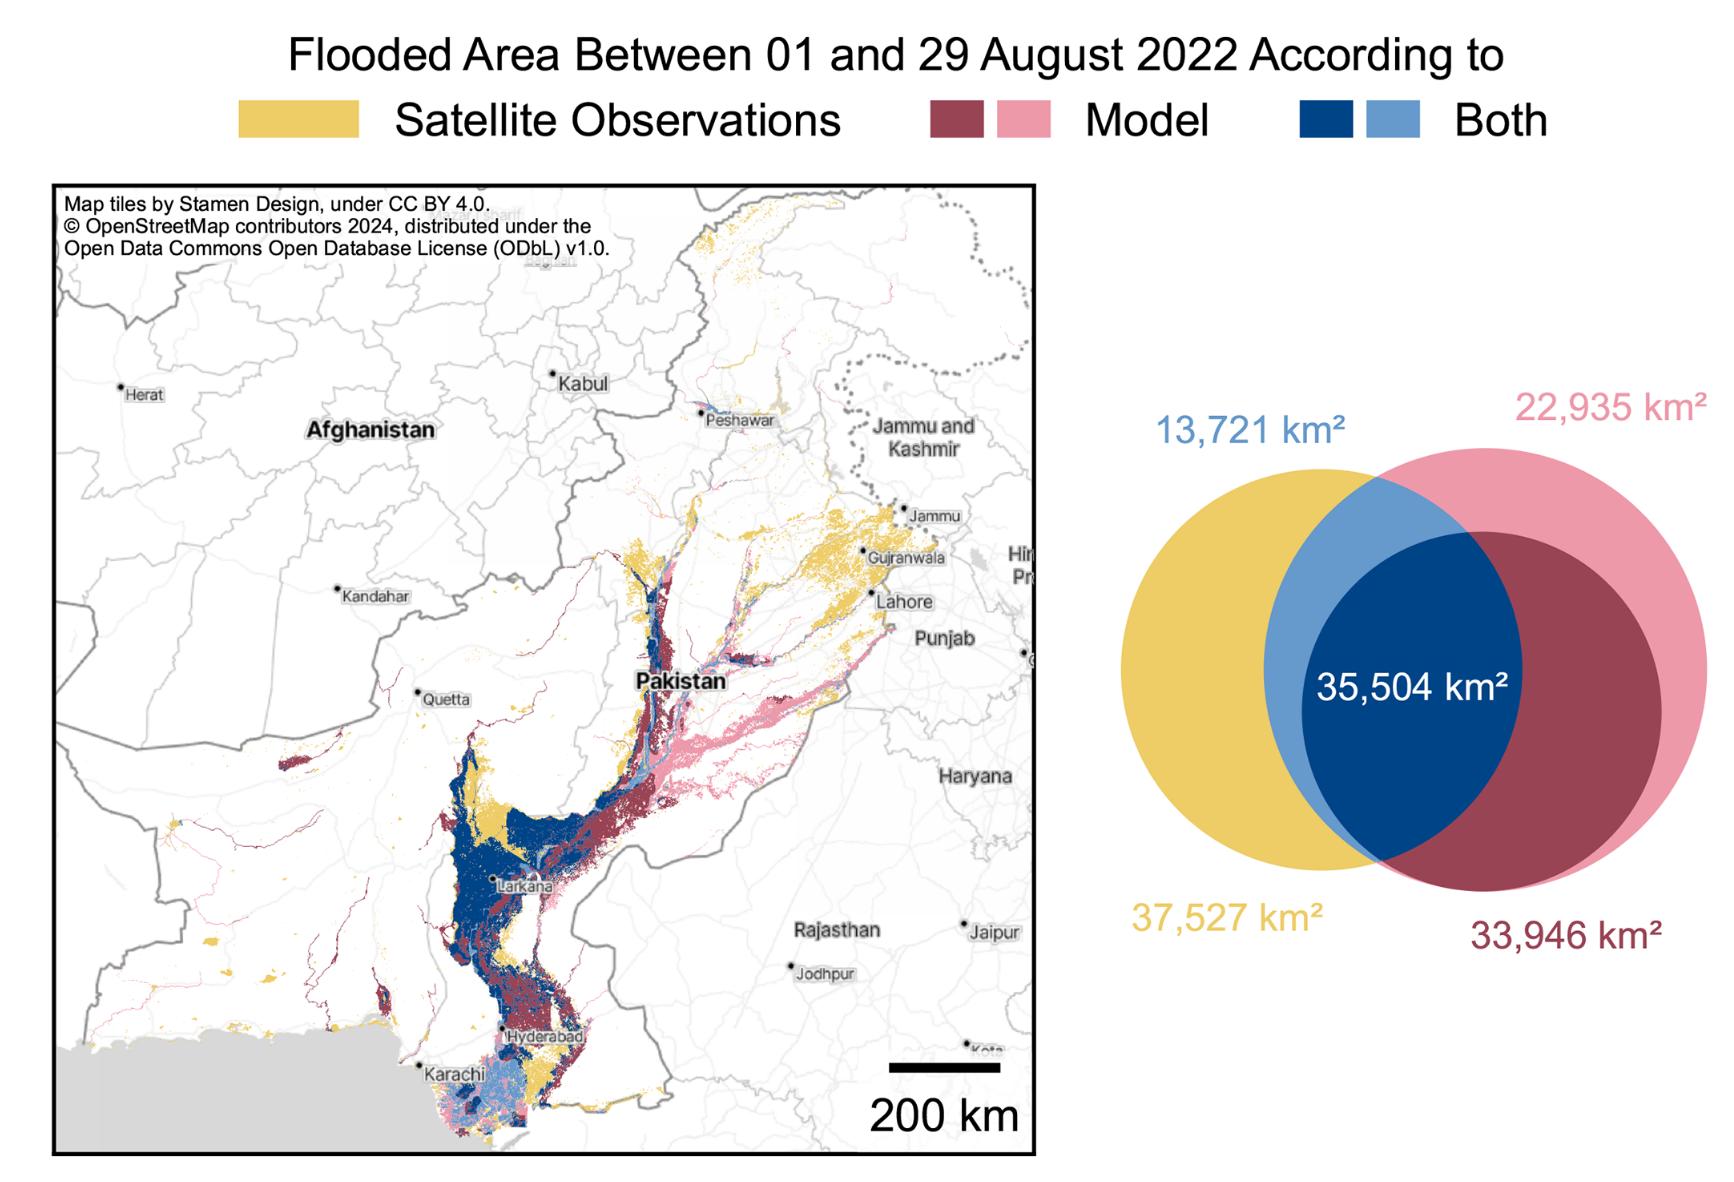
Various Modules to Support the Creation of Hazard Datasets
-
Hazard data is supported in various formats, including raster files (e.g., NetCDF, GeoTIFF) and vector data
(Shapefiles, CSV, Excel).
Data from well-known sources such as ISIMIP, ERA5/6, and CMIP5/6 can be used. Certain datasets are also directly
available through the
data API.
-
Tropical cyclone wind intensities can be computed using several parametric models based on tracks generated from
various sources,
with direct support for tracks from IBTrACS, STORM, CHAZ, and Kerry Emanuel.
-
River flood maps can be derived from GloFAS discharge data using the dedicated module: Riedel, L. et al., Geosci.
Model Dev., 17, 5291,
[DOI: 10.5194/gmd-2021-437].
Major features
Parametric insurance design
A recent study by Steinmann et al. (2023) introduced code for designing and evaluating parametric insurance products.
Steinmann et al.(2023)
[DOI: 10.1007/s10669-023-09934-x].
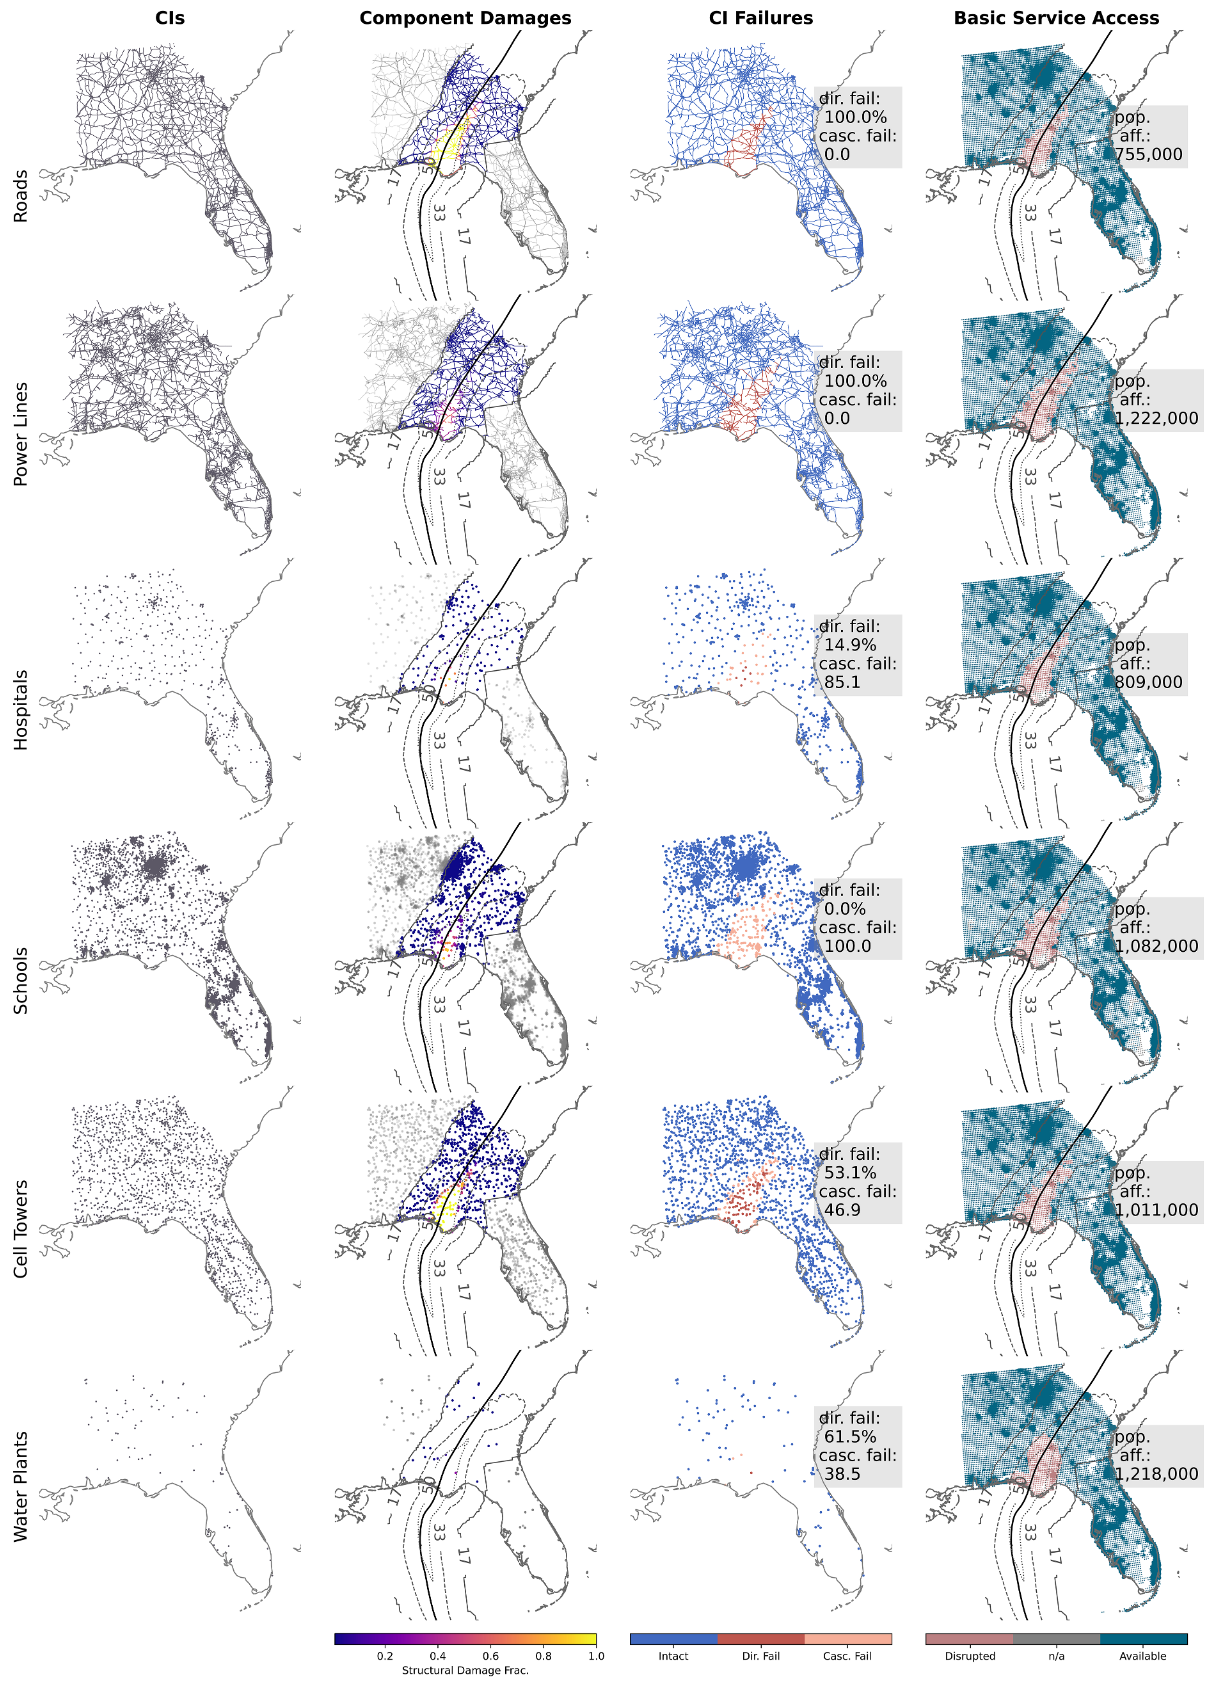
Cascading Critical Infrastructure Risks
The
cascading infrastructure module
enables the computation of indirect impacts of extreme events on critical infrastructure service provision
by modeling cascading failures.
Mühlhofer et al.(2023)
[DOI: 10.1016/j.ress.2023.109194].
Multi-Hazard Risk and Recovery
A recent study by Stalhandske et al. (2024) introduced code for integrating multi-hazard
impact and recovery analysis, which is now publicly available.
Stalhandske et al.(2024)
[DOI: 10.1038/s41598-024-55775-2].